
Own your observability. Get the answers, not just the graphs.
Self-hosted logs, traces, and metrics for .NET teams — with AI root-cause analysis and auto-remediation built in. Your telemetry never leaves your infrastructure.
01 / The trade-off
Option A
Send everything to a SaaS vendor
Unpredictable per-GB bills, and your data lives offsite on someone else's infrastructure.
Option B
Build it yourself from open source
You get data ownership — but also a second full-time job, and still no answer to why it broke.
OpenPulse
A single platform you own outright
Self-hosted, predictable cost, your data inside your network — with the AI analysis layer the DIY stacks lack.

Logs, traces & metrics — braided into one stream you own.
02 / What's inside
Everything you need to see — and understand — your systems.
AI root-cause analysis
Names the likely cause in plain language from correlated logs, traces and metrics.
Auto-remediation (with approval)
Proposes the fix and applies it once you approve. Nothing changes without a human signing off.
Unified logs, traces & metrics
One platform, one view. Follow a request end to end without tool-sprawl.
Native OpenTelemetry (OTLP)
gRPC + HTTP ingestion; services auto-discover. No proprietary agents.
Live real-time dashboards
Telemetry streams in as it arrives. Saved queries, alerting with notifications.
Uptime & certificate monitoring
Endpoints and TLS certs watched continuously. Know before your users do.
Self-hosted storage
PostgreSQL + TimescaleDB via Docker Compose. Your data stays yours.
One-click self-update
Fetch → migrate → recreate → health-check, with automatic rollback on failure.
03 / The wedge
From “something’s wrong” to “here’s why — and here’s the fix”
Dashboards show symptoms. OpenPulse gives a diagnosis. When an incident fires, it analyzes the correlated logs, traces and metrics and explains the likely root cause in plain language — so your engineers start with a hypothesis, not a haystack.
Then it can propose a concrete remediation and apply it, but only after you approve it. That approval gate is the point: the speed of automation with a human in the loop. No silent changes, ever.


03b / Data ownership
Your data never leaves your perimeter.
OpenPulse runs entirely on your infrastructure via Docker Compose and stores telemetry in PostgreSQL and TimescaleDB on your own hardware. No data is ever sent to us.
Native OTLP ingestion means there's nothing proprietary to roll out — point existing instrumentation at it and services auto-discover, all inside your network.
04 / In practice
Built for the way your team actually works.

Debug solo, faster
Correlated logs, traces, and metrics in one view. Follow the thread without juggling five tabs.

Get the team aligned
Put the whole system on the big screen so everyone's looking at the same truth.

Calm at 3 a.m.
When it breaks, get the likely root cause in plain language. Start with a hypothesis, not a haystack.
05 / See it in action
The whole picture, in one pane of glass.
Live demo, white-labeled as “Acme Corp”.
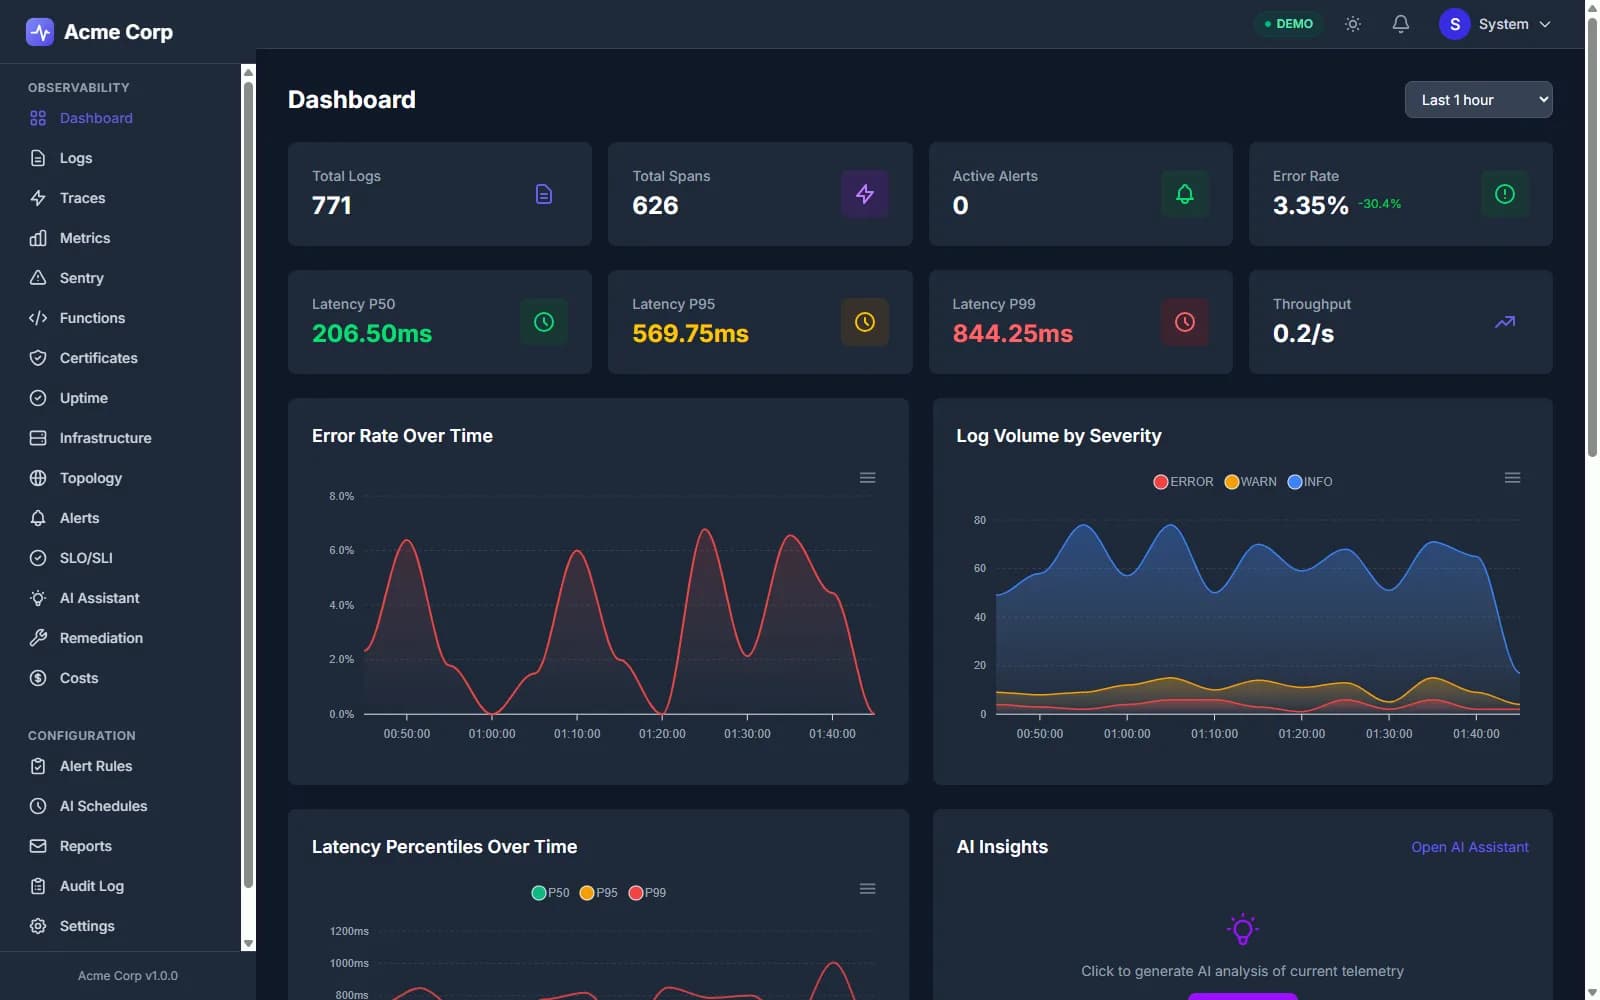
Single-pane health overview — KPIs, error rate, latency percentiles, and AI insights.
06 / Pricing tiers
Pick the tier that matches how far you want the platform to go.
| Capability | Standard | ProRecommended | Enterprise |
|---|---|---|---|
| Logs, traces & metrics | |||
| Live dashboards & saved queries | |||
| Alerting, uptime & cert monitoring | |||
| Native OTLP, self-hosted | |||
| AI root-cause analysis | |||
| Auto-remediation with approval | |||
| SSO / RBAC | |||
| Multi-instance & white-labeling | |||
| Priority support |
Commercial, self-hosted, license-based — no per-GB ingestion billing. Start with a time-limited evaluation license that runs in your own environment.
07 / Teams using OpenPulse
“A standout customer quote about diagnosing incidents faster and keeping telemetry in-house goes here.”
— Engineering lead, placeholder company
08 / FAQ
Is OpenPulse really self-hosted? Where does my data live?
Entirely. It runs on your infrastructure via Docker Compose and stores telemetry in PostgreSQL/TimescaleDB on your hardware. Your data never leaves your network and is never sent to us.
What languages and frameworks does it support?
Anything that emits OpenTelemetry. Ingestion is native OTLP over gRPC and HTTP, so .NET, Go, Java, Python, Node and more all work — point existing instrumentation at it and services auto-discover.
Do I need proprietary agents?
No. If you already emit OTLP, there's nothing new to roll out.
What does auto-remediation do — and is it safe?
It proposes a fix for the diagnosed issue and applies it only after you explicitly approve it. OpenPulse never changes your environment on its own.
How does pricing work? Is there a free tier?
Commercial, license-based across three tiers — no per-GB meter. No free tier; instead a time-limited evaluation license to run the full product on your own infrastructure.
How do updates work?
One click. The licensed updater fetches the new version, runs migrations, recreates services and health-checks the result — rolling back automatically if anything fails.

Run it on your own telemetry this week.
Predictable cost. Your data, your perimeter. And an AI layer that tells you why — and fixes it with your approval.