
Introducing OpenPulse: Self-Hosted Observability with AI Root-Cause Analysis
Observability forces a bad trade-off: an expensive SaaS bill with your data offsite, or a DIY stack you babysit with no AI insight. OpenPulse is the third option — self-hosted logs, traces and metrics with AI root-cause analysis and auto-remediation built in.
Observability shouldn't cost you your data or your weekend
Every team running production software hits the same fork in the road.
Down one path: ship all your logs, traces, and metrics to a SaaS observability vendor. It works on day one — and then the bill arrives. Per-gigabyte ingestion pricing turns a noisy deploy into a budget event, and every byte of your telemetry now lives on someone else's infrastructure, outside your perimeter.
Down the other path: build it yourself from open-source parts. You get data ownership and no ingestion bill — and a second full-time job. Now you're the on-call team for your monitoring stack, stitching together collectors, storage, and dashboards, and you still don't have anything that tells you why the system broke at 3 a.m.
We didn't love either option. So we built a third one.
Introducing OpenPulse
OpenPulse is a self-hosted observability platform for logs, traces, and metrics — with AI-powered root-cause analysis and auto-remediation built in. You run it on your own infrastructure, so your telemetry never leaves your control.
It's the platform we wanted: the data ownership and predictable cost of running your own stack, without the operational burden — and with the AI analysis layer the DIY stacks have never had.
When something breaks, it tells you why
This is the part that makes OpenPulse different from a wall of dashboards.
When an incident hits, OpenPulse correlates the relevant logs, traces, and metrics and gives you the likely root cause in plain language — not just a red graph and a link to 40,000 log lines. Instead of starting the investigation, you start with a hypothesis.
And it doesn't stop at diagnosis. OpenPulse can propose a fix and, with your approval, apply it — auto-remediation behind an explicit approval gate. Passive tools tell you the disk is filling up. OpenPulse tells you why, proposes the remediation, and waits for you to say go. That approval step is deliberate: nothing changes in your environment without a human signing off.
One platform instead of a pile of tools
OpenPulse unifies logs, traces, and metrics in a single place, so you're not context-switching across three tools and four tabs to follow one request through your system.
Ingestion is standards-based: native OpenTelemetry (OTLP) over gRPC and HTTP. Point your existing instrumentation at OpenPulse and your services are auto-discovered from the telemetry itself — no proprietary agents to roll out, no rip-and-replace. If you emit OTLP today, you're most of the way there.
On top of that you get the operational essentials, done well: alerting with evaluation and notifications, uptime and TLS-certificate monitoring, saved queries, and live dashboards that stream telemetry in real time as it arrives.
Self-hosted by design
OpenPulse runs on your infrastructure via Docker Compose, storing data in PostgreSQL with TimescaleDB. Your telemetry stays inside your network, full stop. There's no per-GB meter running, and there's no copy of your production data sitting in a vendor's cloud.
Staying current is a single click. The licensed, registry-based updater fetches the new version, runs migrations, recreates services, health-checks the result — and rolls back automatically if anything fails. Self-hosted, but not "you're on your own."
Who it's for
OpenPulse is built for .NET engineering teams, platform/SRE/DevOps engineers, and engineering leaders at small-to-mid-size companies who run their own infrastructure and care about three things: keeping their data inside their walls, keeping their observability bill predictable, and giving their engineers answers instead of more graphs.
It's built on a .NET 10 backend by people who live in the .NET ecosystem — but because ingestion is pure OTLP, it happily takes telemetry from any language or runtime you've instrumented.
How it works
The shape is simple. Your services emit OpenTelemetry over OTLP to OpenPulse running in your environment. It stores everything in Postgres/TimescaleDB on your hardware and renders it as live, correlated logs, traces, and metrics. When something goes wrong, the AI layer analyzes the correlated signals, names the likely cause, and — if you let it — proposes and applies the fix. You own the whole thing, end to end.
Try it in your own environment
OpenPulse is commercial and self-hosted, licensed in three tiers: Standard for core observability, Pro for the AI root-cause analysis and auto-remediation, and Enterprise for SSO/RBAC, multi-instance, white-labeling, and support.
There's no free tier to box you into a toy. Instead, we give you a time-limited evaluation license so you can run the real thing on your real infrastructure and judge it on your own telemetry.
- Start your free evaluation — request an evaluation license.
- See the live demo — https://openpulse-demo.dotnet-talk.com
- Talk to us about Enterprise.
Keep reading

July 29, 2026 · 7 min
Claude Opus 5: A Working Developer's Assessment of Anthropic's New Flagship
Anthropic released Claude Opus 5 on July 24, 2026 — not just another model bump, but a meaningful shift in what a near-frontier workhorse can do for coding agents and .NET AI applications. Here is a grounded assessment of what actually changes.
Read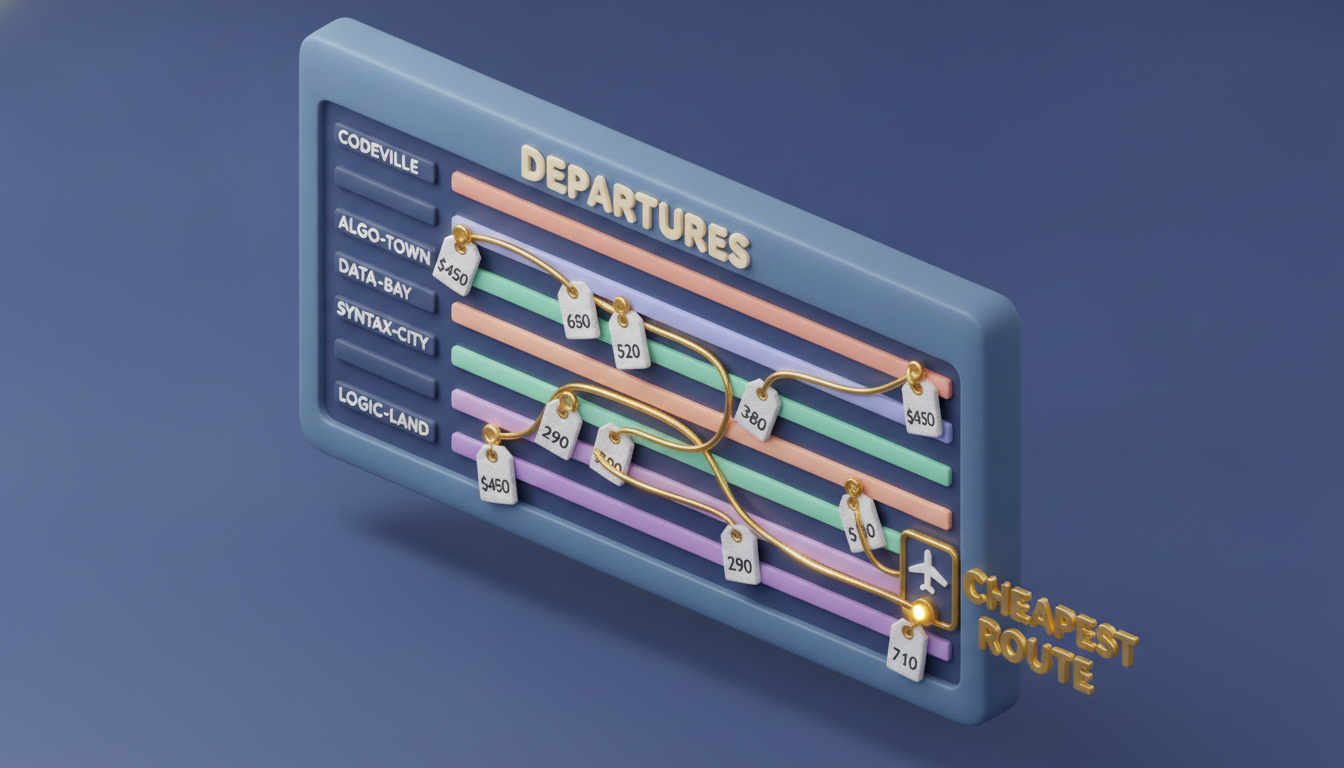
July 27, 2026 · 6 min
Weighted Graphs & Shortest Paths in NebulaGraph with C# — Part 5
NebulaGraph's FIND SHORTEST PATH minimizes hops, not edge weights — so finding the cheapest or fastest route requires enumerating bounded paths and reducing on weight in C#. This article shows exactly how to do that with a flight network schema.
Read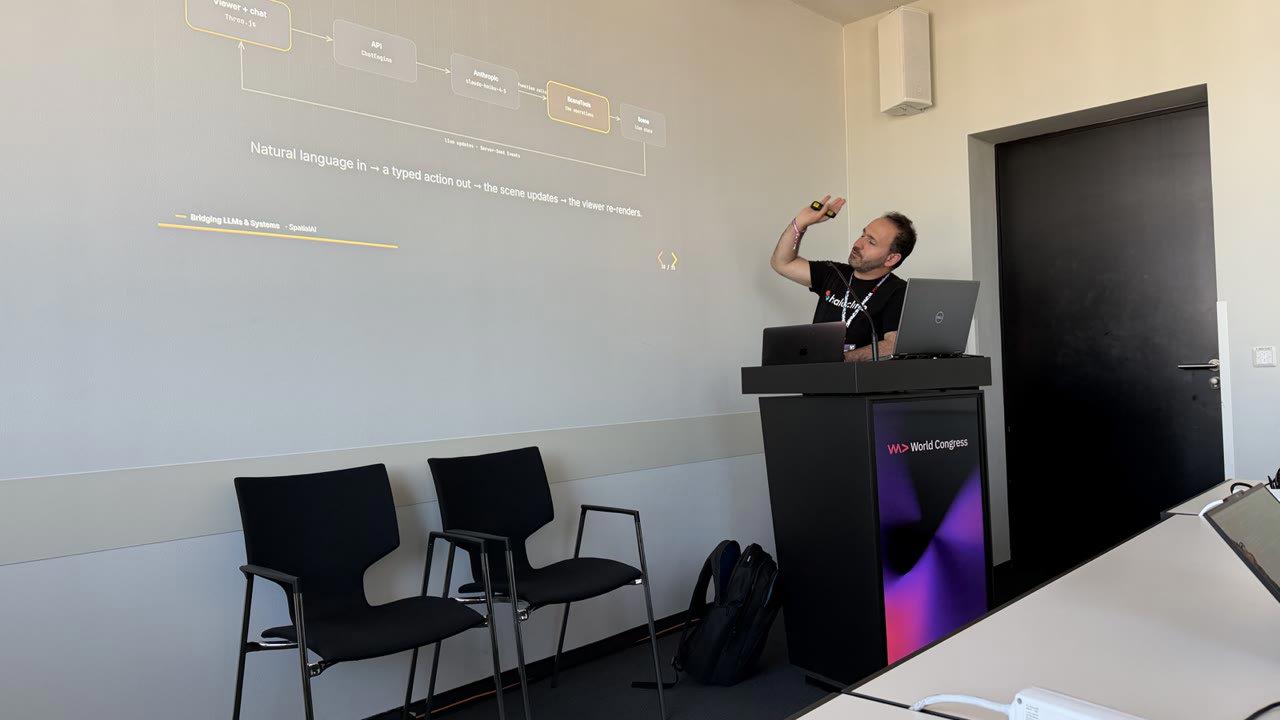
July 22, 2026 · 5 min
My recap of WeAreDevelopers 2026
Two roles at the WeAreDevelopers World Congress 2026 in Berlin: moderating a full afternoon on Stage 3, and running my own workshop on bridging LLMs and real systems with MCP and function calling. Plus the people who made the trip.
Read